

Water bills jump 62% in a decade, outpacing inflation, new study says
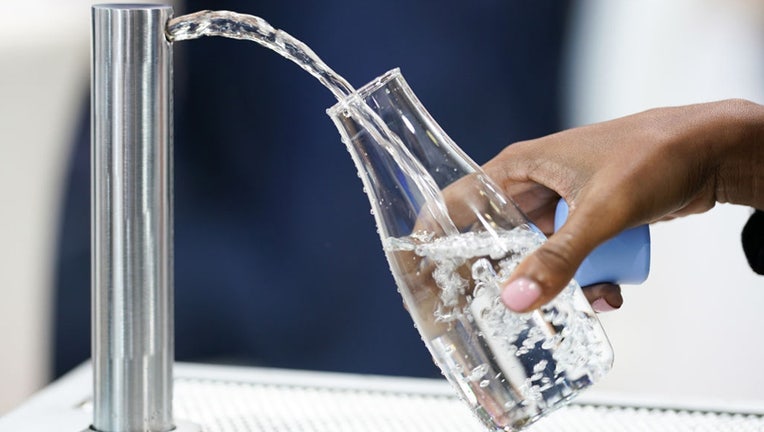
FILE - A woman fills a bottle with water. (Ian Forsyth/Getty Images)
ATLANTA - Drinking water bills are consuming a larger share of household budgets, with costs rising an average of 62% over the past decade, according to a new report from Food & Water Watch.
What we know:
The Washington-based advocacy organization compared 2025 drinking water bills at the nation’s 500 largest water systems with its 2015 findings. Households using 60,000 gallons paid an average of $531 for drinking water in 2025.
The report found widespread affordability problems for low-income households, alongside substantial differences in costs depending on a system’s ownership, location and service area.
Water costs rise faster than household incomes
What they're saying:
Over the decade, water bills increased at 1.6 times the rate of inflation and more than twice the rate of grocery prices, according to the analysis.
Nationally, water bills grew 19% faster than median household incomes. In Louisiana, Maryland, New Hampshire and West Virginia, bills rose about twice as fast as statewide median household incomes.
"A water affordability crisis is rapidly expanding throughout America. While struggling to pay for other essentials like food and energy, many households are grappling with water costs that are rising even faster," said Mary Grant, water policy director at Food & Water Watch.
Corporate systems charge more
Corporate water systems charged typical households an average of 67% more than publicly owned systems in 2025, adding $329 to annual bills.
Households with public water service paid less on average in 2025 than customers of privately owned systems paid in 2015, the report found.
Grant attributed rising costs to corporate control of water systems and declining federal investment in aging infrastructure. She urged policymakers to strengthen corporate oversight, hold polluters accountable and provide dedicated funding for water systems.
Georgia among states with lower-cost systems
Local perspective:
The 25 least expensive water systems charged typical households less than $260 annually. All were publicly owned, and their typical bills amounted to less than 0.5% of their respective states’ 2024 median household incomes.
Sixty percent of those systems were in the South, including many in Georgia and Florida. The group also included systems serving rapidly growing cities such as Dallas, Orlando and Phoenix. Each increased its service population by more than 100,000 people between 2015 and 2025.
Together, the 25 least expensive systems served 30% more people than the 25 most expensive systems, allowing costs to be distributed among more customers.
The report suggested that some lower-cost systems may collect a greater share of revenue from customers who use more water, such as households watering lawns or filling swimming pools. Other systems may include a set amount of water in a base charge before applying additional usage fees.
Research using the organization’s 2015 data also found lower bills at newer systems than in older communities, where aging infrastructure requires costly repairs and replacement.
Low-income households face affordability challenges
Why you should care:
Despite the lower bills at some utilities, the report classified water service as unaffordable for low-income households in 93% of the systems surveyed.
West Virginia had the highest average annual water cost among the states studied, at $1,383, despite having one of the nation’s lowest average household incomes. California and Pennsylvania had multiple systems among the study’s 10 most expensive.
Food & Water Watch said its analysis addresses a gap in public information because no federal agency or other government entity collects the drinking water billing data used in the study.